

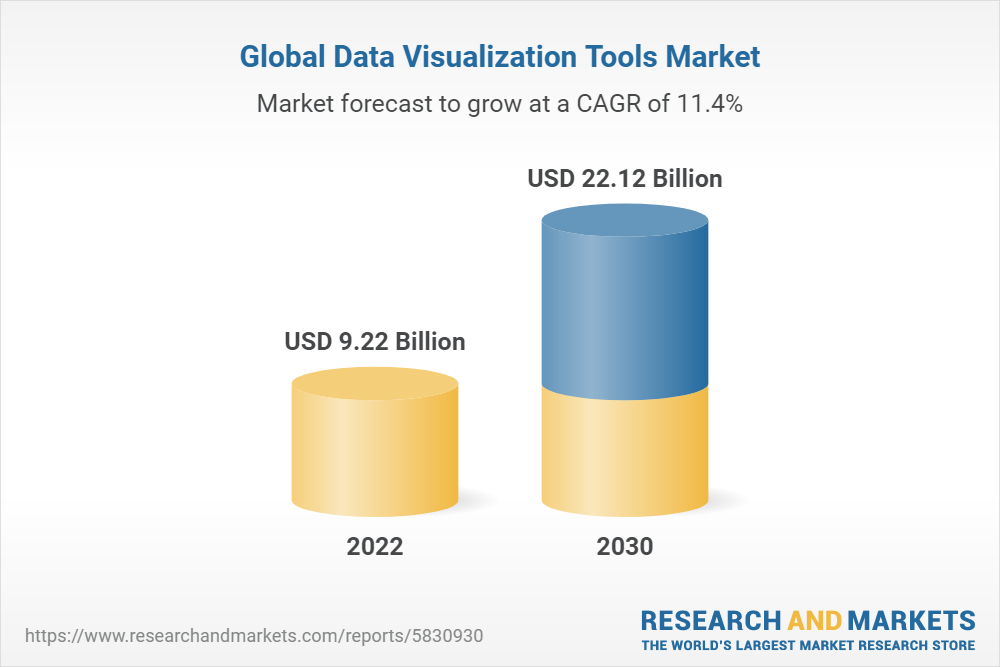
The global data visualization tools market size is expected to reach USD 22.12 billion by 2030, expanding at a CAGR of 11.4% from 2023 to 2030, according to a newly released report.
In today’s business environment, organizations increasingly rely on data-driven decision-making, which has led to a growing need for data visualization tools to help users quickly and easily understand complex data sets. The amount of data generated by organizations has grown exponentially in recent years, and this trend is expected to continue.
Data visualization tools are essential for making sense of this data and identifying patterns and insights. Further, as the importance of data-driven decision-making continues to grow, more organizations recognize the value of investing in data visualization tools which will help businesses gain a competitive advantage by leveraging their data assets to drive business value.
The rise of self-service analytics is a significant feature shaping the data visualization tools market. Self-service analytics refers to the ability of non-technical users to access and analyze data without the need for IT or data science expertise. This trend has emerged in response to the increasing availability of data and the growing demand for data-informed decision-making across all industries.
Traditional data analysis requires a high level of technical expertise, with data scientists or IT professionals often responsible for analyzing and interpreting data. However, the rise of self-service analytics tools has made it easier for non-technical users to access and analyze data themselves without relying on IT or data scientists.
Self-service analytics tools typically have intuitive interfaces and easy-to-use features that allow users to create interactive dashboards, perform ad-hoc analyses, and visualize data without needing extensive technical knowledge, enabling business users to make data-informed decisions on their own without waiting for IT or data scientists to provide insights.
Effective data visualization should communicate clearly with the target audience, considering the audience’s expertise and making the visualization easy to view and understand. One of the key factors to consider when designing a data visualization is the audience’s familiarity with the basic principles being presented.
If the audience is unfamiliar with the data or the principles being presented, the visualization should be designed to be easily understandable, with clear labels, simple language, and a logical flow. On the other hand, if the audience is more experienced or has a background in STEM fields, the visualization can be more complex, with more advanced charts and graphs.
Another important consideration while creating a data visualization tool is the type of data being presented, as different types of data require different types of visualizations.
Data Visualization Tools Market Report Highlights
- The software segment accounted for over 64% share of the global revenue in 2022, owing to the growing need for tools that can assist businesses in analyzing and understanding data
- The marketing and sales segment held the largest revenue share of over 35% in 2022. Data visualization tools are increasingly being used by marketing and sales departments to gain insights into customer behavior, preferences, and trends to make research-based decisions and create more targeted and effective campaigns
- The large enterprises segment held the largest market in 2022, accounting for over 69% share of the global revenue. Data visualization tools help large enterprises decipher Big Data to make better-informed decisions
- The on-premises segment held the largest revenue share of over 59% in 2022. However, cloud-based data visualization tools are gaining popularity due to easier deployment and it does not require the installation of any software or hardware on the user’s device
- The IT and telecommunication segment held the largest revenue share of over 21% in 2022. Data visualization tools supporting predictive analytics provide the IT and telecommunications industry with insights providing companies with a competitive advantage