Former Microsoft CEO Steve Ballmer embarked on a $10 million open data project – and he is prepared to spend more millions of dollars on it annually – because of his frustration over a lack of access to a single data source that combined all the relevant local, state, and federal governments’ figures.
Ballmer and Seattle design studio Artefact launched USAFacts last Tuesday to change the way government data is presented. USAFacts, a $10 million project, is a website that organizes three decades of U.S. data from seventy local, state, and federal government agencies into a centralized hub to present the data in a graphical, easy to understand format so that people can clearly see how government makes and spends money. Ballmer’s team, made up of economists, writers, researchers, and academic experts from Stanford University, the University of Pennsylvania, and Lynchberg College, provided the data in hundreds of spreadsheets and data tables derived from government websites and reports – an exercise that took over two years – while Artefacts’s designers produced several collections of infographics from the data to make it accessible and comprehensible.
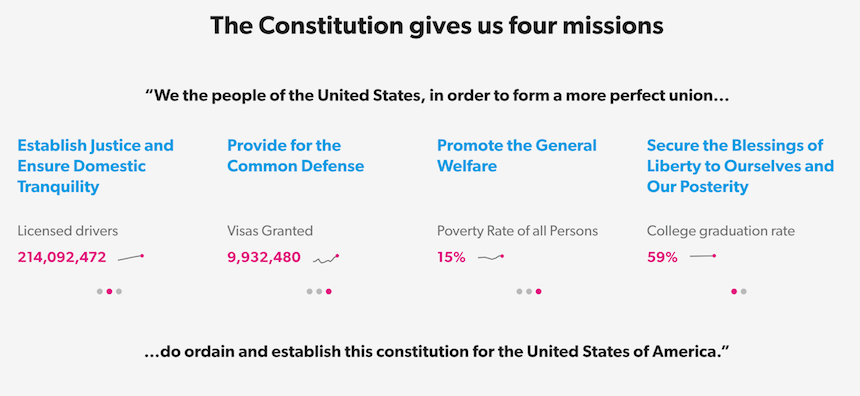
Artefact presented the volume and timing of the available data in infographics to show how relevant data has evolved over time. The information is organized into sparklines, a “small, intense, simple, word-sized graphic with typographic resolution,” also used by Apple to show heart rate on the Apple Watch, and in financial publications to show market data. Dave McColgin, a user experience designer at Artefact said the infographics were designed to make people capture the details without losing sight of the bigger picture. “We wanted to make sure people can spot relationships and trends in related content,” he said.
USAFacts shares the objectives of previous attempts to make government data accessible: the Obama administration launched Data.gov in 2009 to centralize government statistics; and passed the Digital Accountability and Transparency Act in 2014 to make government data accessible and machine readable. OpenGov is a cloud-based platform that powers the budgeting and reporting process, and open data from over 1,400 public agencies to promote accountability and effectiveness.
The ambition of the platform to be unbiased and nonpartisan is currently questionable because infographics are inherently editorialized. Ballmer, who envisions USAFacts as a type of governmental annual report, believes the neutrality of the data should override prospective editorial bias. “We put the data there in an orchestrated way so people can find it and create their own analysis,” he says. In addition, the homepage of USAFacts bears a message that confers a civic outlook on the platform: “the Constitution gives us four missions… [To] establish justice and ensure domestic tranquility, provide for the common defense, promote general welfare, and secure the blessings of liberty.”

